Power BI templates for Agility
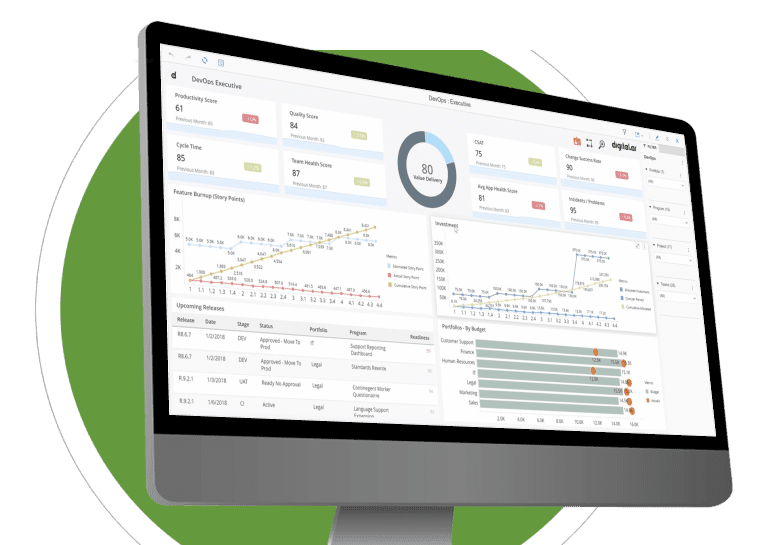
Digital.ai provides a set of prebuilt Microsoft Power BI templates for Agility, built on top of the Agility data mart. Rather than asking teams to learn a new reporting tool, the templates let analysts report on Agility delivery data in the BI platform they already own and know.
The Agility data mart is a denormalised, reporting-optimised representation of the Agility operational database. Digital.ai enables and configures the data mart for your environment; you then connect Power BI to it and open the templates. Because Power BI runs in your environment and reads your own data mart, your delivery data never leaves your security boundary. The templates work across on-premises, private cloud, gov cloud and air-gapped deployments.
Every template is a starting point. Analysts can extend visuals, add measures, apply branding, or use a template as the foundation for their own reports.
Available Templates:
ART Predictability Report: Planned versus actual business value delivered by an Agile Release Train – the SAFe predictability measure.
Planning Level Burn Up: Completed work against total scope over time at a planning level, showing progress even as scope moves.
Portfolio Test Trend: The same quality trend rolled up across a portfolio, for a programme-level view.
Test Trend: Test execution and pass/fail results trended over time at team level.
Throughput Velocity – Sprint Planned vs Completed: Planned versus completed work per sprint, exposing how reliable a team’s commitments are over time.
Coming Soon:
Throughput by Date: Work items completed over a chosen date range, to see delivery rate and spot dips or surges.
Unplanned Work / Scope Change Report: Work added, removed or changed after commitment, quantifying churn against the plan.
Time in Status: How long work items sit in each workflow state, surfacing where delivery stalls.
Cycle Time: Elapsed time from start to done for team-level work items.
Portfolio Cycle Time: Cycle time measured at the portfolio item level, for epics and features.
Portfolio Item Progress Report: Completion status of portfolio items with rollup from their child work.
Planning Level Burn Down – Monte Carlo Simulation: Probabilistic forecast of the completion date for a planning level, based on historical throughput.
Portfolio Item Burn Up – Monte Carlo Simulation: Probabilistic forecast for a single portfolio item, expressed as a range of likely completion dates.
Request Lead Time: Elapsed time from a request being raised to it being delivered, measured end to end.
Availability: Power BI templates and the Agility data mart are available to customers on the Pro and Premium editions. To request the templates, contact your Digital.ai account manager or Customer Success Manager.
Featured in guides
Supported In
 Agility
Compatible With
Digital.ai support

We would be happy to help you!